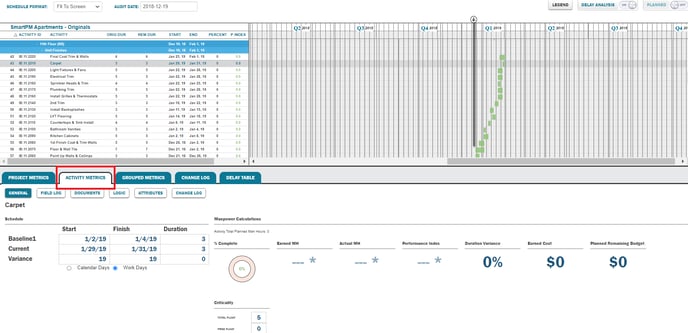
The Activity Metrics of the General Tab will tell you everything you need to know about the progress of any of your individual Activities to date simply by selecting the Activity in the Gantt Chart. Here is how SmartPM calculates all of these Metrics and what the numbers tell you:
Activity Total Planned Man Hours – This figure shows the Total Planned Man Hours that are planned to be expended in completing the Activity. This figure is based on the Total Man Hours shown in the Activity Attributes or the figure submitted in the Total Man Hours field when the Activity was created
Percent Complete – This figure is representative to the Percent Complete entered in the most currently submitted Field Report for the Activity
Earned Man Hours – This calculation shows how many Man Hours should have been expended based on the Activity’s Percentage Complete compared to the listed Planned Man Hours. In other words, it is an indication of how many of the Activity’s Budgeted Planned Man Hours should have been spent to have achieved the Actual Progress.
- The calculation is the Activity’s Total Planned Man Hours multiplied by the Activity’s Actual % Complete
Actual Man Hours - This will show the sum total of Man Hours submitted via Field Reports for the Activity
Performance Index - This is a measure of Man Hour efficiency for an Activity. It is a ratio between what has been done and what should have been done by the current day.
- The calculation is the Activity’s Earned Man Hours divided by the Activity’s Actual Man Hours
Duration Variance – This metric is simply a ratio comparing the Activity’s Actual or Projected Duration to the Original Planned Duration.
- The calculation is 1 – ((Actual/Projected Duration) / (Original Duration)), expressed in a percentage
Earned Cost – This Metric shows how much of the Activity’s Planned Budget should have been expended based on the Current Percent Complete.
- The Calculation is the Activity’s Planned Budget multiplied by the Activity’s Percent Complete
Planned Remaining Budget - This Metric shows how much of the Activity’s Planned Budget should be remaining based on the Current Percent Complete.
- The Calculation is the Activity’s Planned Budget minus the Activity’s Earned Cost
Total Float – The number of working days that the Activity may be delayed from its start date without delaying the project finish date
Free Float – The number of working days that the Activity can be delayed without delaying the start of any immediate successor Activities